

Although Augustus Waller was the first to record an ECG in a human, Willem Einthoven of The Netherlands is considered the father of electrocardiography. Einthoven identified the major waveforms of the ECG, initially named A, B, C, and D. He subsequently changed the naming system to P, Q, R, S, and T waves.
Scalar ECG showing P, Q, R, S, T, and U waves. The J point as well as standard intervals, including the PR interval, QRS duration, ST segment, and QT interval, are shown
The basic concept of the ECG is that electrical potentials generated by the heart can be accounted for by considering these electrical events to be equivalent to those generated by a dipole source in a homogeneous volume conductor (the equivalent dipole model). This concept has the limitation of seriously oversimplifying these events, especially in the assumption of homogeneity of conduction through the chest.
The scalar ECG can be thought of as the record of voltage variation of this dipole with respect to time, in the particular orientation of the lead recorded. Cardiac electrical activity, of course, generates potentials in three dimensions, so any particular lead provides a very small amount of the potentially available information that can be recorded. For this reason, the conventional ECG includes 12 or 15 leads, arranged to give recordings along a variety of lead orientations to better represent the cardiac activity in three dimensions.
Electrocardiographic interpretation begins with artifact-free ECG recordings. In addition to accurate electrode placement, cleaning of the skin with alcohol or acetone is essential to lower the skin resistance. ECG recordings in active infants and toddlers can be a technical challenge.
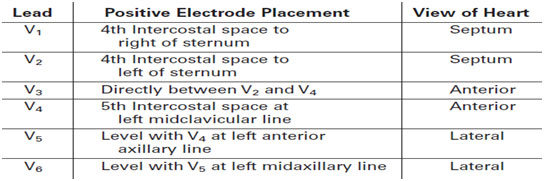
The standard ECG record consists of 12 leads recorded from nine body surface locations with the patient in the supine position. The ideal recorder should have the capability of displaying 3 to 12 leads simultaneously. The standard configuration usually is modified in children and adults with congenital heart disease, to record additional right (V3R, V4R) and left (V7) chest leads. Interpretation of rhythm disturbances is facilitated by viewing a rhythm strip with 3 or, better, 12 simultaneously recorded leads
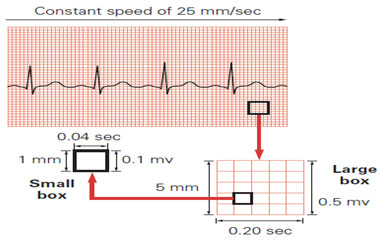
Electrocardiograms can be recorded at various paper speeds and at various voltage standardizations. Paper speeds of 12.5, 25, and 50 mm/s have been used, but 25 m/s is standard. Standard ECG recording paper has major time divisions at 5-mm intervals and minor time divisions at 1-mm intervals. Therefore, at a paper speed of 25 mm/s, each large block corresponds to 0.20 seconds (200 ms), and one second is represented by five large blocks. Each small block represents 0.04 seconds (40 ms). In terms of voltage, full standardization refers to 1.0 mV/10 mm in vertical deflection on the recording, whereas half standardization refers to 0.5 mV/10 mm. It is important that the ECG reader always checks standardization prior to interpreting the ECG because the use of half standardization is common when large voltages cause overlap between leads. With the exception of the signal-averaged ECG, it is uncommon to discuss or report ECG voltages in terms of millivolts. It is much more common to discuss them in terms of millimeters of amplitude at full standardization.
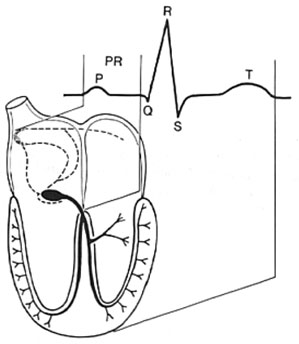
P wave- atrial depolarization, QRS – ventricular depolarization, T wave – ventricular repolarization
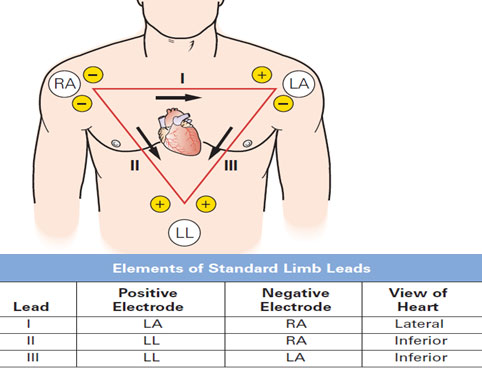
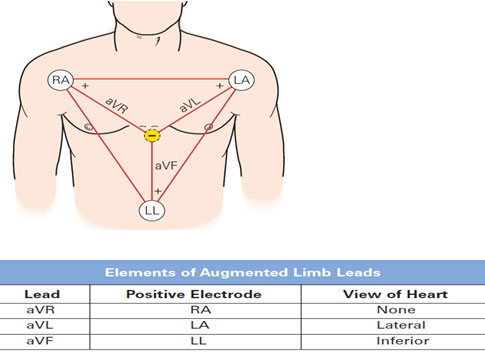
Types of ECG leads- limb leads, precordial leads and augmented leads
Pediatric ECG features are age dependent. The PR interval, ST segment, and T wave are heart rate dependent as well. The zero-voltage baseline, which is the reference level for ECG voltage measurements, is based on the fact that no potential differences exist on the body surface at that instant. At slow heart rates, the T-P or U-P interval is a good approximation of the voltage baseline. At faster heart rates, the P wave may be superimposed on the previous T-U wave. In this situation, the PR segment is the best alternative
Standard ECG Speed 25mm/sec
In one minute; 25 x 60 = 1500 mm
HR (ventricular rate) = 1500/ Number of small square between RR wave (in case of regular RR interval)
When RR interval is irregular, count number of R wave in 6 seconds strip and multiplies it by 10 which will give the average HR/min of patient (1 second = 25 small boxes/ 5 big boxes)
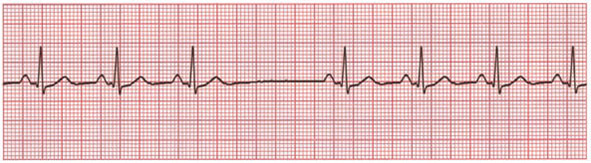
Average HR in this strip is 7 x 10 = 70 (as there are 7 R waves in 6 seconds)
Similarly atrial rate is calculated from PP interval
Normal resting heart rate
| – Newborn | 90-180 |
| – – 6 months | 105-180 |
| – 1 year | 105-170 |
| – 2 years | 90-140 |
| – 4 years | 72-135 |
| – 6 years | 65-135 |
| – 10 years | 65-130 |
| – 14 years | 60-120 |
On most ECGs, there will be normal AV conduction with P waves preceding each QRS complex. It is important to determine if the P wave originates from the sinus node or elsewhere. The vector of a sinus P wave is from top to bottom and right to left (positive in leads I, II, and aVF). The P wave in sinus rhythm is biphasic in lead V1, initially being upright followed by a brief downward deflection. If the P wave does not have these characteristics, it does not originate from the sinus node and has an ectopic location. One must ascertain its origin For example, a rhythm in which the P wave is inverted in leads I and aVL is termed a left atrial rhythm, whereas a P wave that is inverted in leads II, III, and aVF is termed a low right atrial rhythm (also known as a coronary sinus rhythm).
The rhythm may be regular, irregular, or regular with intermittent but predictable phases of irregularity. The last would be a description of phasic sinus arrhythmia, which results from normal vagally mediated accelerations and decelerations of the sinus node in response to respiration. One also may observe tachyarrhythmias such as atrial tachycardia or AV reciprocating tachycardia rather than sinus rhythm.
One assesses both conduction time by measurement of the PR interval and the relationship of P waves to QRS complexes. The PR interval is age, activity, and heart rate dependent. Impaired AV conduction is described as first-, second-, or third-degree AV block. Abbreviated conduction, manifested by a short PR interval, occurs in WPW syndrome, glycogen storage disease, and the presence of a low atrial pacemaker located closer to the AV node.
Normally, ventricular depolarization occurs virtually simultaneously at many sites, resulting in a QRS of brief duration. QRS duration is age dependent. It is <80 ms from infancy through age 8 years, and less than 90 ms throughout childhood and early adolescence. QRS duration is an objective measure that can be determined reliably using computerized ECG recording systems. QRS duration may be prolonged by right or left bundle branch block (LBBB), ventricular pre-excitation, or a ventricular pacemaker. The term intraventricular conduction delay is reserved for those situations when QRS is prolonged but does not fit any of the above categories.
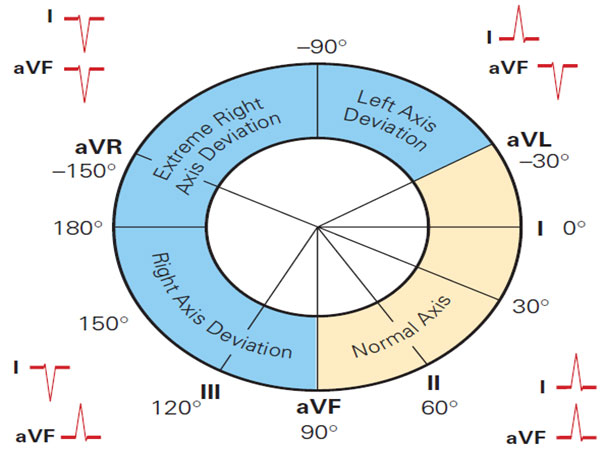
The direction of the QRS complex in leads I and aVF determines the axis quadrant in relation to the heart.
| 1 wk – 1month | +30 - +180 (+110) |
| 1-3 months | +10- +125 (+70) |
| 3 month- 3 yr | +10- +110 (+60) |
| > 3yrs | +20-+120 (+60) |
| Adults | -30-+105 (+50) |
Same as QRS axis
Normal P duration- 0.08 sec in infants, 0.10 sec in children, maximum amplitude of p wave 2.5 mV
It represents time for atrial depolarization. It is measured from beginning of P to beginning of R wave. Upper limit is 0.16 seconds and in newborn 0.12 seconds. Short PR interval is <0.1sec.
It represents time for both ventricular depolarization and repolarization. It is measured from beginning of QRS to end of T wave. QT interval varies with HR and thus corrected QT (QTc) is calculated by Bazzett formula.
T wave is upright (+) in V1 till day 7 of life. By day 7 of life T should invert/be flat. If T wave is still positive in V1 by day 7 of life then RVH. It remains negative during childhood and by 8-10 years it again becomes upright. Pericarditis is the most common cause of ST-segment elevation in children. It is also seen in early repolarization in adolescents and ischemia. Characteristically, in pericarditis these findings differ from ischemic changes in that they involve all leads.
The hallmark of the ECG changes in the normal infant and child are the age-related transitions of QRS morphology, QRS duration, and the pattern of the ST segment and T wave. During normal development, there is a gradual decrease in heart rate and an increase in P-wave duration, PR interval, and QRS duration. Compared with those at older ages, the QRS voltages are low during the first several months of life. The mean QRS axis in the frontal plane moves in a direction from right to left.
The right ventricular dominance of the infant was one of the first age-dependent ECG changes to be recognized. Loss of right ventricular dominance starts at about 1 month of age, and left ventricular dominance is well established by 1 year. These changes are appreciated best by the R-wave progression in the precordial leads during the first year of life. At birth and for the first several weeks of life there are tall R waves and small S waves in the right and anterior precordium (V3R, V4R, and V1), and deep S waves and small R waves in the left precordium (V6 and V7).
In the first minutes after birth, the T-wave vector is anterior and to the left (upright in V1 and V6). The T-wave vector may swing rightward in the next several hours, producing flattening or inversion of the T wave in the left lateral leads. Over the next 7 days, the T-wave vector moves posterior and leftward, producing an inverted T wave in V1 and an upright T wave in V6. Finally, the T wave becomes upright again in V1 after 8-10 years of age, but may remain inverted throughout adolescence (so-called juvenile T-wave pattern).
Compared with the ECG of term infants, the initial ECG of the premature infant is notable for its shorter QRS duration. The PR interval and QT interval also are shorter. The ECG of the premature infant is characterized by less right ventricular dominance at birth than the ECG of the full-term infant. At 1 year of age, the heart rate of the premature infant exceeds that of the term infant. Furthermore, precordial voltages are lower in the 1-year-old infant who was premature.
In children, the primary uses of ECG include initial evaluation of patients with suspected cardiovascular disease and serial evaluation of the patient with known cardiovascular disease. The ECG is indispensable for evaluation of the patient with known or suspected disorders of rhythm and conduction, including patients with palpitations and syncope. ECGs also are indicated for determining the response to antiarrhythmic drugs or drugs with potential cardiac effects. There appears to be little rationale for routine ECG screening of asymptomatic, ostensibly normal young patients till 35- 40 years. This argument applies to routine well-child examination as well as to preoperative screening.
Copyright © 2020 Dr. Gaurav Garg All Rights Reserved | Healthcare Web Design Agency Medkeon